
The robotaxi squeeze: legacy carmakers face a shrinking core market
Contents
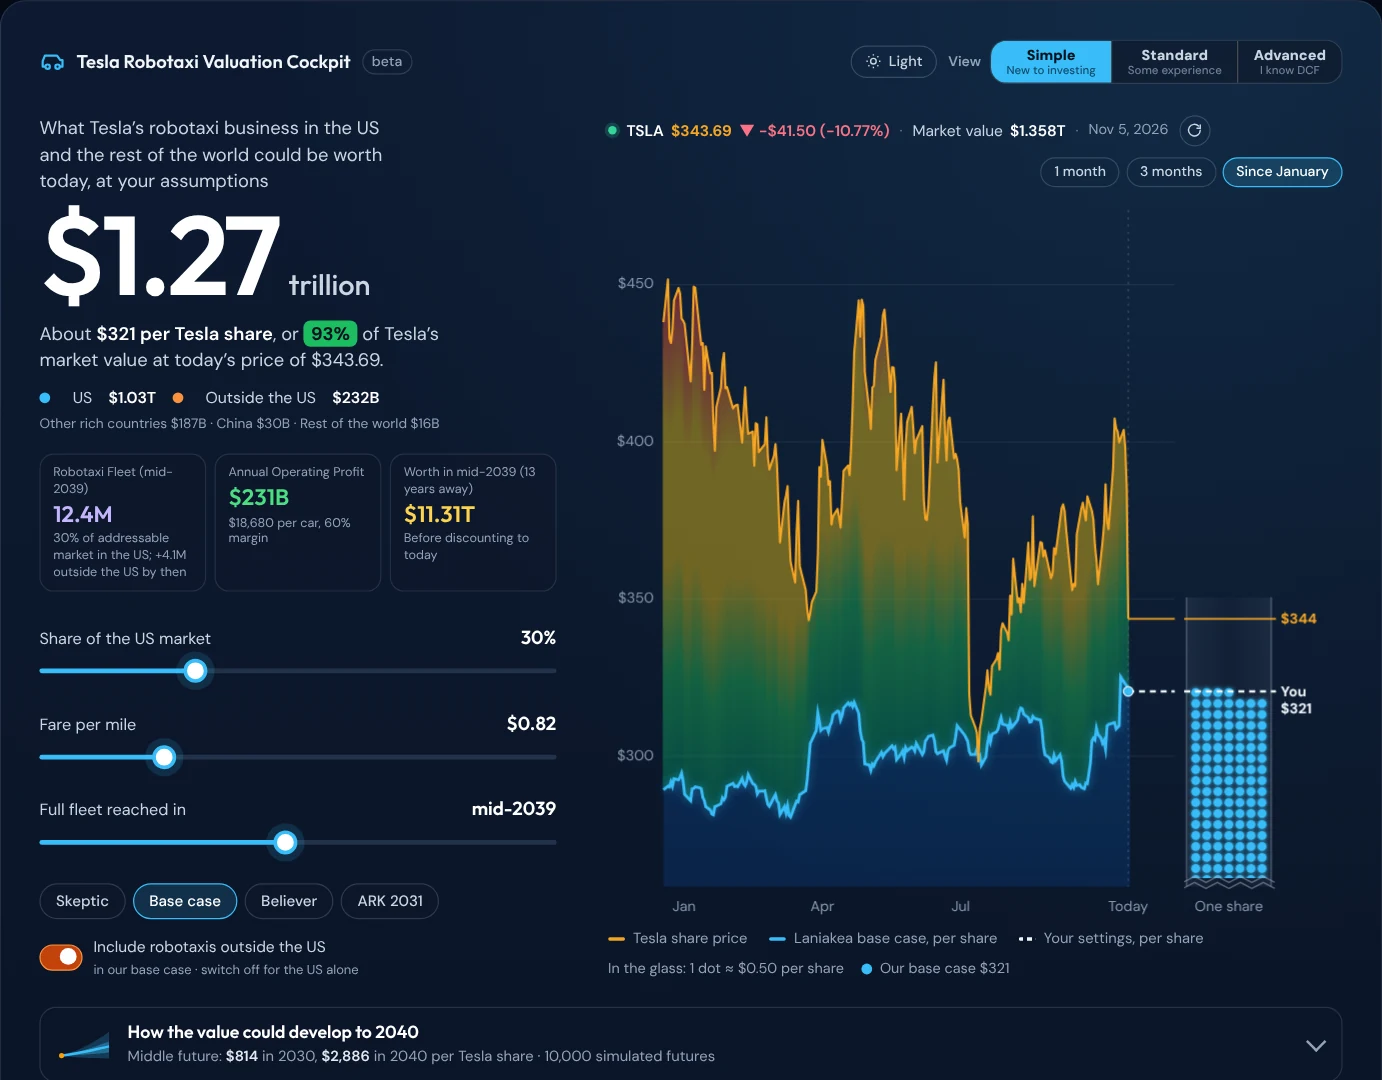
Bottom line. We expect robotaxis to replace car ownership for many people in large US cities, and the shift to be recognised by investors well before it shows up in carmakers' sales. At scale, a purpose-built robotaxi can offer a chauffeur at about the cost of owning a car, $0.82 a mile in our base case, while its operator keeps an operating margin of about 60%. Because riders do not choose a robotaxi by its brand, and cost falls with network density, we expect two to four networks per market; the privately owned self-driving cars that remain will be a more open market, where we expect Tesla's share to be much smaller. We place the turning point at about 250,000 robotaxis on US roads, late 2029 on our base-case rollout. If half of new riders give up a car, US new-car purchases run about a fifth below today's level from 2032. We see a material risk that many legacy carmakers are reduced to suppliers of commodity vehicles or to a niche of hobby drivers. Our view is well ahead of the more cautious outlook published by Goldman Sachs Research, and we set out where and why. We value Tesla's robotaxi business at $1.27 trillion today ($321 per Tesla share): $1.03 trillion in the US and $0.23 trillion in the rest of the world, where robotaxis arrive 3 to 10 years later and people travel far less by car.
Key messages
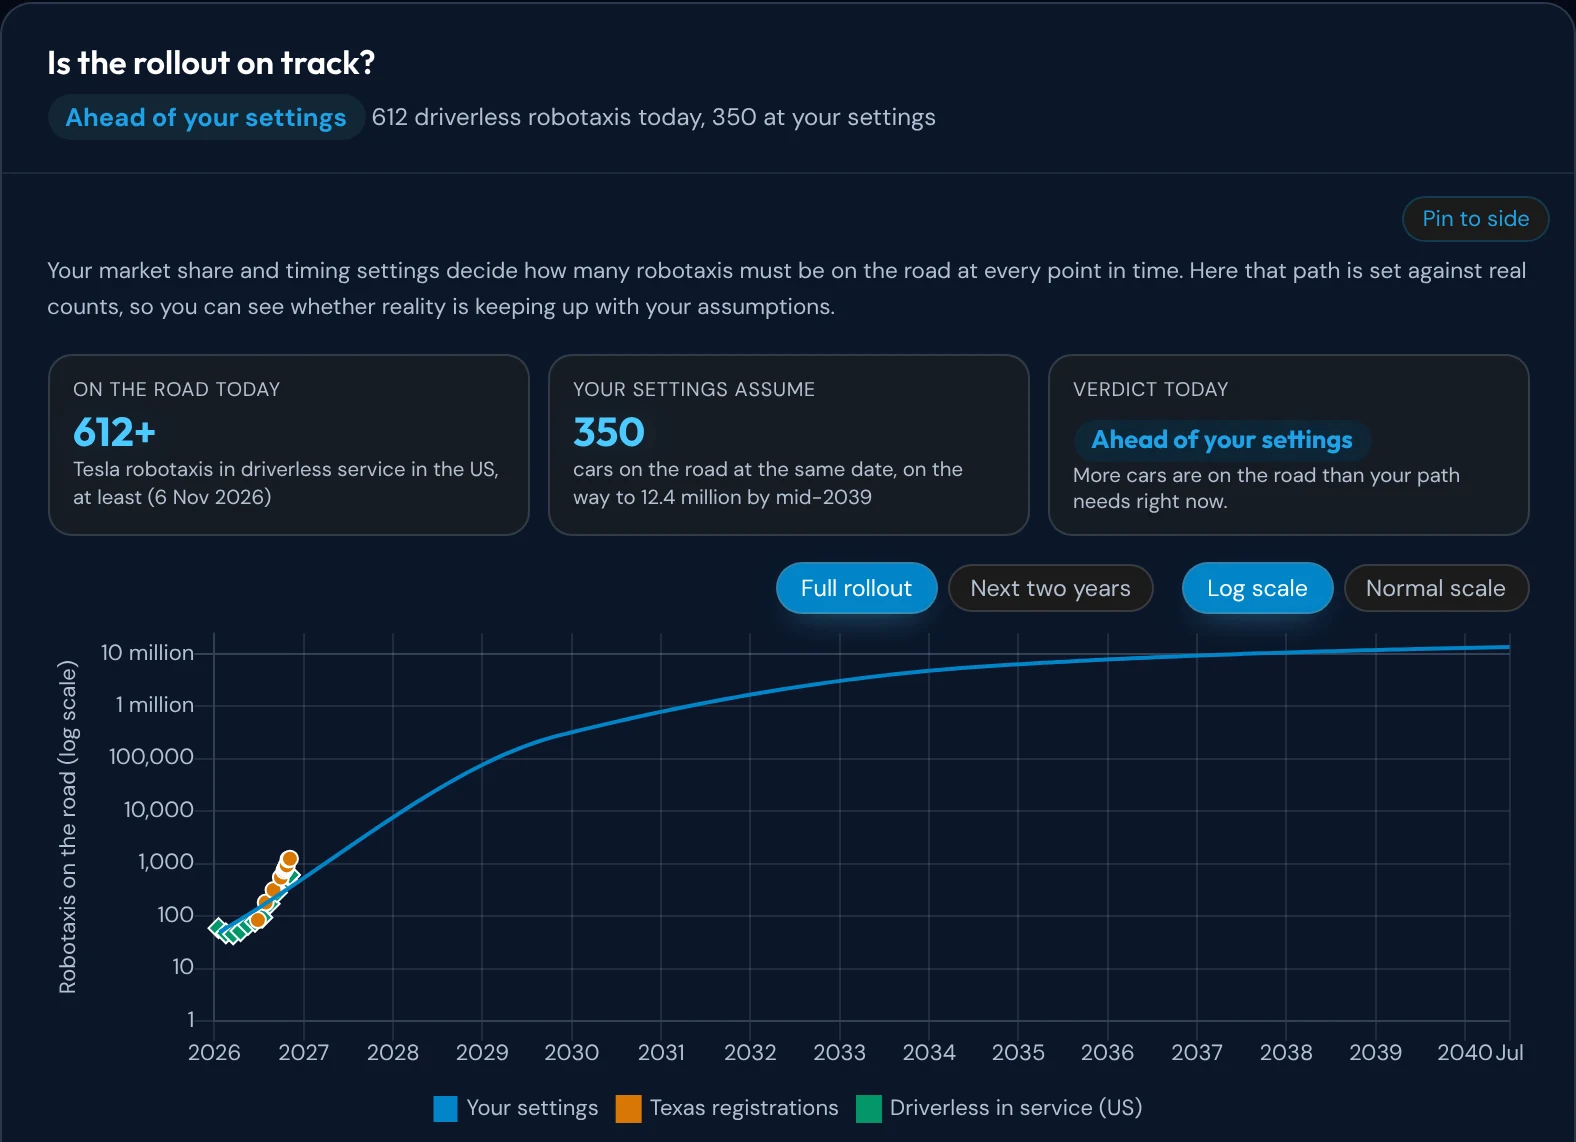
- Deployment is outpacing the early part of our rollout curve. Tesla's automated vehicles registered in Texas rose from 84 at the end of June to 1,244 on 6 November 2026, and at least 612 Tesla robotaxis drive in the US without anyone in the driver's seat, against about 350 on our curve (Exhibit 1). We keep our base case unchanged for now and would review our timing if the fleet reaches about three times our curve by the end of 2026.
- A chauffeur at the cost of ownership. We estimate a Cybercab costs about 33 cents per paid mile to run at scale, against 51 cents for a converted Model Y and 69 cents for Waymo's Zeekr. At $0.82 a mile, the rider pays about what a car costs, gains about 365 hours a year, and the operator keeps about 60% (Exhibits 2 and 3).
- Riders will prefer the robotaxi at the same price and wait. Privacy, a known and consistent vehicle, a safety record that can be measured, no personal responsibility for a crash, and in-ride connectivity and entertainment, with Starlink designed into the Cybercab, make the ride better, not just less expensive.
- Two to four networks, not dozens of brands. Brand loses its value when nobody drives; density, depots, capital and local driving data all reward scale (Exhibit 5). Aggregator apps widen the choice of fleets, not the number of viable vehicle brands.
- Not everyone gives up the car, and our case does not need them to. City dwellers are most likely to switch completely; many suburban households will keep one car; rural drivers keep theirs, because robotaxis need density. Our market is the 300 largest urban areas, and our base case serves about one in five Americans (Exhibit 6). Privately owned self-driving cars will be a more open market, where Tesla may lead at first but should expect a much smaller share.
- An early turning point. We expect investors to price the shift at about 250,000 US robotaxis, late 2029 on our base case, years before any distress at carmakers becomes visible (Exhibits 7 and 8).
- A structural decline in the core market of legacy carmakers. US new-car purchases would be about 13% below 2025 sales in 2031 and more than 20% below in each year from 2032 to 2036 (Exhibit 9); the US carmakers with the thinnest margins are the most exposed (Exhibit 10).
- Well ahead of consensus. Goldman Sachs Research expects about 3 million autonomous vehicles in the US in 2035 and considers concerns about falling car ownership overstated, at least for the next decade. We see more than 6 million Tesla robotaxis alone in the US by the start of 2035 (Exhibit 11). We test our assumptions every week and adjust them as new evidence arrives.
- Valuation. $1.27 trillion in our base case, $1.03 trillion in the US and $0.23 trillion outside it, at 30 times profit (Exhibit 12); 8 in 10 of 10,000 simulated futures between $0.45 trillion and $2.32 trillion, with a middle value of $1.12 trillion and an average of $1.29 trillion (Exhibits 13 and 14). Outside the US we size each market by today's car travel, so we assume robotaxis do not take riders from public transport. The turning point does not change today's value; it steepens the path to it (Exhibit 16).
1. Deployment is outpacing the early part of our rollout curve
Tesla started its robotaxi service in Austin in June 2025 with about ten cars and a safety monitor in the passenger seat. Seventeen months later the scale is different. Texas registration data compiled by Robotaxi Tracker show 84 automated Tesla vehicles at the end of June 2026, 546 at the end of September, 1,204 at the end of October and 1,244 on 6 November, 573 of them Cybercabs, the two-seat vehicle Tesla designed for the job with no steering wheel and no pedals. Registered vehicles are not all in service yet; the driverless count, at least 612 vehicles across the US on 6 November, is the better measure.
Exhibit 1: Real counts are running ahead of the early part of our rollout curve
Source: Robotaxi Tracker (Texas DMV data; driverless US count), Laniakea Research robotaxi cockpit.
Our base-case curve reaches 12.4 million robotaxis by mid-2039 and puts about 350 on the road today; the real fleet is about 70% larger. We do not change our base case on that alone. The early part of any rollout is small and lumpy, and the value we estimate depends on when the full fleet is in place, not on the first thousand vehicles. Our rule is to review the timing if the fleet stays well ahead: if it reaches about three times our curve by the end of 2026 (about 1,500 robotaxis against about 530), we would bring the full-fleet year forward.
The supply side is ready for a faster pace. Tesla's third-quarter update lists installed capacity for more than 125,000 Cybercabs a year, well above what our base case needs through 2028, while noting that installed capacity is not current output. We believe the main constraint today is regulation and permits. Federal motor vehicle safety standards were written for vehicles with a steering wheel and pedals; NHTSA ordered Tesla to explain under oath how the Cybercab complies; Tesla answered by the 30 October 2026 deadline and asked for parts of its answer to be kept confidential, and NHTSA has not yet made a finding. NHTSA has separately proposed rules that adapt lighting standards to vehicles driven only by software. Once the federal questions are settled, we expect city and state permits, not factory output, to set the pace.
2. This thesis has been made before: what is different now
Forecasts of a fast shift to robotaxis have a poor record. In 2017, the think tank RethinkX predicted that by 2030 95% of US passenger miles would be served by on-demand autonomous electric vehicles and 70% fewer cars would be built each year. In April 2019, Tesla said it expected more than a million robotaxis on the road in 2020; its driverless service started in June 2025 with about ten cars. In 2022, McKinsey reported that companies saw robotaxis as the largest autonomous-driving revenue pool, with up to $1.3 trillion of revenue by 2030. None of these is on track, and readers are right to ask why our view should be different. We see four differences.
The service exists. Earlier forecasts were made before any driverless service carried paying riders. Today Waymo averages about 500,000 paid rides a week across 15 US cities (September 2026), and at least 587 Tesla robotaxis drive in the US without anyone in the driver's seat. The open question is no longer whether software can drive, but how fast fleets grow.
Our costs are built up, not assumed away. RethinkX assumed transport four to ten times less costly per mile than owning a new car. We assume riders pay about what owning a car costs ($0.82 a mile), and we build the operating cost line by line from published prices (Exhibit 3). The rider's main gain is the hour behind the wheel, not a collapse in price.
The vehicle is being built for the job. Earlier forecasts relied on vehicles that did not exist at a price nobody had shown. The Cybercab is in production, with installed capacity for more than 125,000 a year.
Our timeline is a decade later. Our full fleet arrives in mid-2039, and the fall in new-car purchases starts in 2030. RethinkX's end state for 2030 is roughly where our rollout only begins to matter. We also price the risk of being wrong: a 5% business-specific premium in our discount rate, and a simulation of 10,000 futures in which 1 in 10 is worth less than $0.59 trillion. We test our assumptions every week and publish every change to our base case in the cockpit's weekly history of our valuation.
3. Unit economics: a chauffeur at the cost of ownership
A ride-hailing trip with a driver costs about $3.25 a mile today, most of it labour; a typical 4.6-mile trip costs about $15. Robotaxi fares are not yet much lower: Tesla's riders in Texas pay about $2.45 a mile on trips over four miles, according to fares logged by Robotaxi Tracker. Owning and running a new car costs $7,972 a year plus 24 cents a mile, or $11,577 a year at 15,000 miles, according to AAA, before parking. The average driver spends 60.4 minutes a day behind the wheel and drives 31.1 miles.
Once fleets reach scale, removing the driver and using a vehicle built only for the job brings the fare in our base case to $0.82 a mile in 2025 prices, or $3.77 for the same trip. That is roughly what owning a car costs per mile. In effect, the chauffeur comes free: the rider pays about what driving would cost and gets the hour back, while the operator earns an operating margin of about 60% (before tax, corporate overhead and software development).
Exhibit 2: What a household would save by switching to robotaxis (interactive)
Source: AAA (2025; fact sheet), AAA Foundation (2024), Laniakea Research. Parking and the value of time are user inputs.
At US averages (11,350 miles a year, so about $10,700 for a new car), a household replacing one car with robotaxis would save about $2,600 a year in money, including $1,200 of parking as an example, and about $6,200 a year once 365 hours of driving are valued at just $10 an hour. The comparison is with a new car: an older car that is paid off costs less to run, so for its owner the main gain is the time. We believe this is compelling enough that many people in large cities will stop driving themselves. Our base case gives Tesla 30% of the people in the 300 largest US urban areas, served by its robotaxis or by self-driving Teslas they own; it does not require everyone to give up a car (Section 6).
The cost advantage depends on purpose-built hardware. Exhibit 3 compares the Cybercab with a converted Model Y and Waymo's next-generation Zeekr, all run at our base-case utilisation and fare.
Exhibit 3: A purpose-built robotaxi costs less than half as much per mile as Waymo's next-generation vehicle
| Per vehicle, our base case | Cybercab (at scale) | Tesla Model Y | Waymo Zeekr |
|---|---|---|---|
| Vehicle cost | about $25,000 | $37,252 | about $80,000 |
| Efficiency (miles per kWh) | 5.5 | 3.8 | 3.6 |
| Insurance (a year) | $2,000 | $4,520 | $4,500 |
| Operating cost per paid mile | 33 cents | 51 cents | 69 cents |
| Operating margin at $0.82 a mile | 60% | 38% | 16% |
| Months to earn back the vehicle | 11 | 20 | 44 |
| Value of the business, our base case (US and the rest of the world) | $1.27 trillion | $0.80 trillion | $0.34 trillion |
Source: Laniakea Research robotaxi cockpit (vehicle presets; 14 operating hours a day, 40% empty miles, 4.6-mile trips, 256 vehicles per remote supervisor). Vehicle costs are estimates; Tesla has said the Cybercab will cost less than $30,000; the Model Y figure is the vehicle price used in our cockpit, without robotaxi equipment. Operating cost includes depreciation, energy, maintenance, insurance, charging and cleaning facilities, remote supervision and fees, but not corporate overhead or software development.
Almost every cost line favours the purpose-built design: lower build cost, helped by Tesla's camera-only approach without lidar, higher efficiency, a smaller battery sized for city duty, lower insurance and maintenance. Tesla's finance chief said on the third-quarter call that Tesla has not yet reached its goal of 30 cents a mile; our 33 cents is a mature-fleet estimate. With an 11-month payback, a Cybercab fleet can largely fund its own expansion. A fleet of $80,000 vehicles can operate at $0.82 a mile, but earns little.
4. Riders will prefer the robotaxi, not just because it costs less
Price is only part of the case. We expect riders to choose a robotaxi over a car with a driver even at the same price and waiting time, for several reasons.
Privacy and predictability. There is nobody to talk to, and nobody listening. The rider knows in advance what arrives: the same clean vehicle, the same seats, the temperature and music they set in the app. With a human driver, every trip is a different car, a different driving style and a different person.
Safety. A software driver does not get tired, distracted or impatient, and its record can be measured. In a study led by the insurer Swiss Re, Waymo's 25.3 million driverless miles produced 88% fewer property-damage claims and 92% fewer bodily-injury claims than human drivers. Without a driver, there is also no stranger in the car. We expect riders, and parents sending their children, to trust a robotaxi service with a published safety record more than an unknown driver.
No more responsibility for a crash. A driver who causes a crash is responsible for it, legally and personally. About 39,000 people died on US roads in 2024 (NHTSA). In a robotaxi the rider is a passenger, and the operator carries the risk of an accident. For many people, from new drivers to older ones, no longer bearing the risk of causing a serious or fatal accident is a relief in itself.
The ride becomes time to use. Without a driver's seat or steering wheel, the cabin is built around the rider. The Cybercab has a large central screen for streaming and games, and Elon Musk has said riders will be able to plug in a PlayStation or Xbox. What used to be time behind the wheel becomes time to work, watch or play.
Connectivity from space. Tesla has announced that Starlink V5 is integrated into the Cybercab (Tesla on X, 20 July 2026), without saying when; the Cybercabs now being built may not have it yet. The vehicle drives itself with its own computer, but a satellite link gives riders fast internet everywhere and, in our view, a second channel when remote support needs to step in where mobile networks are weak. Few competitors can match that, and it is a further edge in a market where riders compare the experience, not the badge.
A generation less attached to driving. Young Americans already get a driving licence later and less often. The share of 16-year-olds with a licence fell from 46% in 1983 to 25% in 2014, and of 18-year-olds from 80% to 60% (University of Michigan Transportation Research Institute). For people who never learn to drive, a robotaxi is not a replacement for a car they own, but the normal way to get around. Each new generation that grows up with robotaxis widens the market.
What riders say, and what they do. Surveys are not on our side yet. Most Americans have never been in a driverless car and say they would not be comfortable in one. What riders do where the service exists points the other way: in San Francisco, riders pay more for a Waymo than for an Uber or Lyft and wait longer for it, and the few who have ridden are far more comfortable than those who have not (Exhibit 4).
Exhibit 4: Survey evidence and rider behaviour
| Finding | Source | |
|---|---|---|
| Against | 5% of US adults have ridden in a driverless car; 71% would not be comfortable riding in one | Pew Research Center, survey of February 2026 |
| Fewer than one in four consumers are comfortable riding in a fully self-driving vehicle; confidence essentially unchanged for three years | J.D. Power Mobility Confidence Index, June 2026 (survey of April 2026) | |
| The arrival of Uber and Lyft raised car registrations per person by 0.7% on average | Ward et al., iScience, 2021 | |
| For | 40% of those who have ridden in a driverless car would be extremely or very comfortable doing so, against 5% of those who have not | Pew Research Center, February 2026 |
| Waymo averages about 500,000 paid rides a week and serves 15 US cities, most of them launched in the past year | TechCrunch, September 2026 | |
| Waymo took more than 14% of ride-hailing spending in San Francisco in the first two weeks of January 2025, about seven months after opening its service there to all riders in June 2024 | Earnest Analytics, January 2025 | |
| Average Bay Area fare: Waymo $19.69, Uber $17.47, Lyft $15.47; average wait 5.7, 3.2 and 5.1 minutes | Obi, via TechCrunch, 27 November 2025 to 1 January 2026 | |
| Riders who started using Waymo took 11% more ride-hailing trips in total | YipitData, first half of 2026 against 2025 |
The evidence is strongest that riders like the product once they have tried it, and weakest on the step that matters most for carmakers: giving up a car. Ride-hailing at more than $3 a mile did not reduce car ownership, and we know of no recent, reliable survey on whether people would give up a car for a robotaxi at the cost of ownership, because no city offers that price yet. This is the assumption we watch most closely; the first test will be car registrations in the cities where robotaxis reach scale first.
5. Industry structure: two to four networks, not dozens of brands
We see three reasons why the robotaxi market will be far more concentrated than the car market.
First, brand stops mattering. A private car is a product the owner drives and displays; the brand carries status. A robotaxi is a service. Today's ride-hailing customers rarely care which car arrives; they care about price, waiting time, safety and cleanliness. Fleet operators, in turn, choose vehicles on a single number: cost per mile. That compresses the vehicle market to the few makers that build purpose-made robotaxis at the lowest cost.
Second, density decides cost. The more free cars near a rider, the shorter the wait and the fewer empty miles between rides. Smaller networks suffer longer waits, more empty miles, lower utilisation and less scale in everything else. Each additional rider lowers the cost of the largest network further. The effect is visible today: in the Bay Area at the end of 2025, Uber's average wait was 3.2 minutes, while Tesla's much smaller service, still with a safety driver, averaged 15.3 minutes (Obi). McKinsey estimates that robotaxi operators at scale could reach price points six to eight times lower than subscale rivals.
Exhibit 5: Splitting riders between more networks raises everyone's cost (interactive illustration)
Source: Laniakea Research. Square-root rule of spatial matching, calibrated on our base case (three networks, 40% empty miles, 33 cents per paid mile).
Moving from three to ten networks raises the cost per paid mile from 33 to about 43 cents in this illustration; at around 70 networks no operator covers its costs at $0.82.
Third, the rest of the system needs scale too. A national fleet of 12 million robotaxis costs about $300 billion. Each city needs depots for charging, cleaning and maintenance, on scarce land near demand. The safety record regulators look at, and the local driving data that make the software safe in a city's specific traffic, road layout and weather, both grow with miles driven. A new entrant starts with none of these.
Aggregator apps will soften this at the edges. Uber already offers Waymo rides in some US cities, and such platforms could show fleets from several vehicle makers. We therefore expect riders to see two to four services, with vehicles from a handful of makers behind them, but not dozens of competing brands: vehicles are chosen on cost per mile, and density, depots and data remain with the largest fleets. Urban transport has always looked like this. Most cities have a single main public transport operator, and US ride-hailing consolidated to two companies within a decade: Uber accounted for 76% of US ride-hailing spending in March 2024, with Lyft holding most of the rest (Bloomberg Second Measure).
Why Tesla can be one of the few. Today Waymo is far ahead: it states a fleet of about 4,000 driverless vehicles, against about 600 Tesla robotaxis tracked with nobody in the driver's seat (Robotaxi Tracker, 4 November 2026). We expect Tesla to become one of the leading networks for three reasons. First, cost: at about 33 cents per paid mile, a Cybercab costs about half as much to run as Waymo's next-generation Zeekr (Exhibit 3). Second, scale: Tesla builds its own vehicles and has installed capacity for more than 125,000 Cybercabs a year. Third, Tesla drives with cameras and its own computer, without lidar, so each vehicle costs less to equip. Our base case therefore gives Tesla 30% of the US market: one of a few leaders, not the only one.
6. Who gives up the car, who keeps it, and what our case requires
The central question for this thesis is not whether robotaxis work, but how many people stop owning a car. We expect the answer to differ sharply by where and how people live, and we see three broad groups.
City dwellers who give up the car entirely. In dense urban areas a robotaxi can arrive within minutes, parking is expensive, and many households already drive little. For them, a chauffeur at the cost of ownership replaces the car; in many households the second car goes first.
Households that keep one car but drive it less. Many suburban families will give up a second car and keep one for holidays, camping, long trips, transporting equipment, or simply as storage that is always there. Their everyday miles move to robotaxis, and the car they keep is replaced less often.
Rural and small-town drivers who keep their cars. Robotaxi economics depend on density. Where homes are far apart, a fleet cannot keep a free car near every rider: waits are long, empty miles are high and fares cannot fall to $0.82 a mile (Exhibit 5 shows how quickly costs rise as density falls). Here private ownership is likely to remain dominant for a long time.
Wealthier drivers are a further case. Some will keep a private car for comfort, privacy, status or the pleasure of driving, even though it costs far more than using a robotaxi; for them, cost does not decide.
Why one robotaxi serves about 5.5 people. A private car is driven about an hour a day and parked the rest of the time. A robotaxi works about 14 hours a day: about 29 paid rides, or 220 miles including the trips to the next rider, and roughly 48,000 paid miles a year. Americans drive about 9,700 miles per person a year (3.29 trillion vehicle miles in 2024, FHWA via FRED, across about 340 million people). One robotaxi therefore covers the driving of about five people at the national average, and more in cities, where people drive less than the average. We use 5.5. This is why a fleet of 12.4 million robotaxis can serve about 68 million people. Not everyone served gives up a car, however: in Exhibit 9 we assume that half of new riders do.
This is why our addressable market covers only the 227 million people living in the 300 largest US urban areas, about two thirds of the roughly 340 million Americans (Census Bureau, 2024 estimate), and leaves rural and small-town America out entirely. Even within that market, our base case does not assume that everyone gives up a car.
Exhibit 6: What our base case requires in the US
| People | Share of Americans | |
|---|---|---|
| US population | about 340 million | 100% |
| Outside the 300 largest urban areas (rural areas and small towns): not in our market | about 113 million | about 33% |
| In the 300 largest urban areas: our addressable market | 227 million | about 67% |
| Served by Tesla in our base case (30% of the addressable market), by robotaxi or by a self-driving Tesla they own | about 68 million | about 20% |
Source: US Census Bureau (2024 estimate), Laniakea Research robotaxi cockpit (5.5 people per robotaxi, 12.4 million robotaxis by mid-2039).
Privately owned self-driving cars: a more open market. The networks and the cars people keep will not look alike. For robotaxi services, density and scale point to two to four networks (Section 5). Privately owned cars do not share riders, so they lack that network effect, and more makers will share the market. Tesla may lead at first: it can offer self-driving to private owners earlier because of its current lead in autonomy, and its robotaxi network gives it more driving data and a faster way to validate the software in each city. But other carmakers and technology companies will catch up, and advances in AI and faster chips may eventually make self-driving far easier to build. Tesla's approach also suits private cars better. It drives with cameras and its own computer only, while Waymo and most others add lidar and radar units that raise the cost of each car and are mounted visibly on the roof and body. That keeps Tesla's cars less costly to build and looking like ordinary cars; many people would hesitate to own a car covered in sensors. Still, we expect Tesla's share of privately owned self-driving cars to be much smaller than its share of robotaxi rides.
How this enters our valuation. Our market share counts people served either by a Tesla robotaxi or by a self-driving Tesla they own. When a customer chooses to own a self-driving Tesla instead of using the network, Tesla is paid for the car up front and charges a monthly fee for self-driving; we assume it earns similar profits per car that way, and receives the price of the car earlier. Our case therefore rests on many urban drivers switching to robotaxis and some others choosing a self-driving Tesla, not on everyone giving up their car. Most of our 30% comes from the networks; we assume only a small share of the privately owned market.
What remains for legacy carmakers. The cars people keep will need to drive themselves too: after years of being driven around town, few people will want to steer for eight hours on a highway. Carmakers that can offer competitive autonomy, their own or licensed, can keep part of this market, but autonomy is hard to build from outside: General Motors ended its Cruise robotaxi programme in December 2024. Those without it are left with a smaller market of sports, off-road, leisure, classic and luxury vehicles: a niche for people who drive because they enjoy it.
7. Timing the turning point
Markets do not wait for car sales to fall or for carmakers to fail; they price a change once its direction is clear. We expect that point when robotaxis are a visible part of daily life in many US cities and their unit economics show in reported results. On our base-case rollout, that is around 250,000 robotaxis on US roads, in late 2029, when robotaxis already outnumber the roughly 204,000 taxi and ride-hailing driver jobs counted by the Bureau of Labor Statistics. That count includes ride-hailing drivers only where it is their main job; most of the more than one million people who drive part-time for Uber or Lyft are not in it.
Exhibit 7: Milestones on our base-case US rollout
| Milestone | Our base case |
|---|---|
| More robotaxis than taxi-driver jobs today (about 204,000, incl. ride-hailing drivers whose main job it is; BLS) | mid-2029 |
| Our turning point: about 250,000 robotaxis | late 2029 |
| One million robotaxis on the road | 2031 |
| Robotaxis serve 4% of the people in the largest US cities | end of 2031 |
| US new-car purchases running about a fifth below today's level | from 2032 |
| Full fleet: 12.4 million robotaxis, about 18% of US vehicle miles | mid-2039 |
Source: Laniakea Research robotaxi cockpit, BLS. People served: 5.5 per robotaxi.
Exhibit 8: The turning point on our rollout, and its effect on the value path (interactive)
Source: Laniakea Research robotaxi cockpit (base case as of 6 November 2026).
8. Implications for legacy carmakers
Exhibit 9 translates our rollout into lost demand for new cars in the US. We assume each robotaxi serves 5.5 people, half of new riders give up a car, and Americans own 0.88 vehicles per person (FHWA, 2024).
Exhibit 9: Estimated reduction in US new-car purchases from robotaxi adoption
| Year | Robotaxis added in the year | People newly served | Fewer new cars purchased | vs 2025 US sales (16.2 million) | Fewer private cars on the road, year-end |
|---|---|---|---|---|---|
| 2030 | 0.5 million | 2.6 million | about 1.1 million | about 7% | about 1.9 million |
| 2031 | 0.9 million | 4.9 million | about 2.1 million | about 13% | about 4.0 million |
| 2032 | 1.4 million | 7.6 million | about 3.3 million | about 21% | about 7.4 million |
| 2033 | 1.7 million | 9.4 million | about 4.1 million | about 25% | about 11.5 million |
| 2034 | 1.6 million | 8.6 million | about 3.8 million | about 23% | about 15.3 million |
Source: Laniakea Research robotaxi cockpit; US sales: NADA (summary); vehicles per person: FHWA. Illustrative. Robotaxi production is itself vehicle output, but it accrues to the robotaxi makers.
Annual additions to the fleet peak in 2033, when our S-shaped rollout curve is steepest, and ease afterwards as the fleet approaches its full size; the fleet itself keeps growing every year. The loss for carmakers is therefore not a one-off: the number of private cars that are no longer needed keeps rising, by about 15 million by the end of 2034 against 298 million registered vehicles today. On this measure alone, the shortfall eases to about 20% in 2037 and 16% in 2039 as additions slow. The table leaves out a second effect that grows over time: a private fleet that is about 30 million cars smaller by the late 2030s also needs fewer replacement cars every year.
For context, US sales fell from about 16 million in 2007 to about 10 million in 2009, and two of the three large US carmakers went through bankruptcy. Car making carries high fixed costs, so profits fall much faster than volumes. A sustained shortfall of more than 20% from 2032, concentrated in the urban markets that drive volume, would be structural rather than cyclical. Outside the US, slower regulation would delay but not avoid the same pressure.
Exposure differs widely between carmakers (Exhibit 10). The US carmakers and the Japanese makers depend most on North America; the German makers least. Because factories, development and staff cost about the same whether a carmaker delivers more or fewer cars, profits fall much faster than sales. To illustrate, we estimate what 20% fewer North American sales would do to 2025 operating profit, assuming that for every $100 of lost sales, the carmaker loses $25 of profit (the price minus the parts, materials and labour that go into the car). This is our assumption; with $20 or $30 the effects scale in proportion.
Exhibit 10: Exposure of large carmakers to the US market (2025)
| Carmaker | US share of vehicles sold | North America share of revenue | Operating margin (as reported) | Illustration: 20% fewer North American sales, effect on operating profit |
|---|---|---|---|---|
| General Motors | 46% | 83% | 6.9% (EBIT-adjusted, company) | about −60% |
| Ford | 48% | n/a | 3.6% | about −65% (unit share used) |
| Honda | 47% (North America) | 58% | −10.0% (automobiles) | already loss-making |
| Nissan | 29% | n/a | −2.2% (automotive) | already loss-making |
| Toyota | 31% (North America) | 41% | 7.4% (group) | about −30% |
| Stellantis | 27% (North America) | 40% | −0.5% | already loss-making |
| Hyundai Motor (excl. Kia) | 24% | n/a | 6.2% (consolidated) | about −20% (unit share used) |
| BMW Group | 17% | 24% (Americas) | 5.3% | about −25% |
| Mercedes-Benz (Cars and Vans) | 15% | n/a | 5.0% (Cars) | about −15% (unit share used) |
| Volkswagen Group | 7% | 19% | 1.8% (Automotive Division) | about −50% |
Source: company annual reports and results releases for 2025 (GM, Ford, Honda, Nissan, Toyota, Stellantis, Hyundai, BMW, Mercedes-Benz, Volkswagen); Laniakea Research. Toyota, Honda and Nissan: fiscal year to March 2026. Unit measures differ (deliveries, retail sales, wholesales, shipments). Margins are adjusted operating margins as reported. The illustration assumes $25 of profit lost per $100 of lost sales and no cost cuts; it is not a forecast.
Two points stand out. First, the carmakers most exposed are also among those with the thinnest margins: a fifth fewer North American sales would remove most of GM's and Ford's 2025 operating profit before any cost cuts. Second, the German makers are less exposed through the US but face the same shift later in Europe, where Volkswagen's margin leaves little room.
We see three paths for legacy carmakers: become suppliers to robotaxi networks, competing on cost per mile against purpose-built designs; license autonomy from others and cede much of the margin; or retreat to the niches where people still choose to drive. In our view, many will not come through this transition in their current form.
9. Where we differ from consensus
Goldman Sachs Research's latest public outlook on robotaxis, published in April 2026, is a useful benchmark for the mainstream view. It sees a global robotaxi market of about $415 billion in 2035, a global commercial fleet of about 1 million vehicles in 2030 and about 6 million in 2035, and gross margins of 30% to 50% for operators that build and run their own fleets.
Exhibit 11: Our view against Goldman Sachs Research
| Laniakea Research base case | Goldman Sachs Research (April 2026) | |
|---|---|---|
| Robotaxis, 2030 | about 0.8 million Tesla robotaxis in the US (end of 2030) | about 1 million robotaxis worldwide |
| Robotaxis, 2035 | about 6.3 million Tesla robotaxis in the US at the start of 2035, 7.8 million at the end | about 3 million autonomous vehicles in the US; about 6 million robotaxis worldwide |
| Cost per mile at scale | 33 cents (Cybercab, operating cost) | cost of goods below $1 a mile by 2035 |
| Fares | $0.82 a mile at scale (2025 prices) | could reach $1 a mile or less in the long run |
| Vehicles per remote supervisor | 256 | 6 today, 26 by 2035 |
| Car ownership | many people in large cities give up a car; rural drivers keep theirs | concerns about falling ownership overstated, at least for the next decade |
| US new-car sales | about a fifth below today from 2032 | 10 to 13 million a year only in an extreme scenario where all miles shift to shared autonomous vehicles |
Source: Goldman Sachs Insights, "Robotaxis are forecast to become a $400 billion market in 2035" (30 April 2026); Laniakea Research robotaxi cockpit. Our fleet figures are for Tesla alone in the US; outside the US our base case adds about 11 million Tesla robotaxis, with the regions complete between 2042 and 2049.
The gap comes from three assumptions. First, cost: we assume a purpose-built vehicle at about $25,000 and a mature fleet, while Goldman's cost path starts from today's more expensive vehicles. Second, supervision: we assume one remote supervisor can oversee 256 robotaxis at maturity, against 26 in Goldman's 2035 estimate; at 26, our cost per paid mile rises from 33 to 42 cents and our value falls from $1.27 trillion to $1.04 trillion ($263 per share). Third, behaviour: we believe a chauffeur at the cost of ownership changes how people use cars much faster than in Goldman's base case. We see the first two as tests that real fleets will settle within a few years, and the third as the core of our thesis.
We do not have a crystal ball. Our base case is our best judgement today, and several operating assumptions, such as remote supervision, empty miles and operating hours, will only be settled by real fleet data. We therefore test our assumptions every week against new information, from robotaxi counts and fares to company disclosures and regulatory decisions, and adjust them when the evidence requires it. Every change to our base case, and the reason for it, is published in the cockpit's weekly history of our valuation.
10. Valuation: Tesla's robotaxi business
Our cockpit values Tesla's robotaxi business at $1.27 trillion today in our base case, or about $321 per Tesla share. We build the value in three steps.
The US business. At $0.82 a mile and 33 cents of operating cost, each robotaxi earns about $18,680 a year after tax. With 12.4 million robotaxis by mid-2039, that is $231 billion a year in 2025 prices, or about $308 billion with 2% inflation a year. At 30 times profit, the US business would be worth about $9.2 trillion in mid-2039. That value is almost 13 years away and the plan could be late or fail, so we discount it at about 19% a year, a rate that includes a 5% premium for the risk that the business does not succeed. Today, that is $1.03 trillion.
Why we value only the finished fleet. We do not add the profits of the years between now and mid-2039. There are three reasons. First, the costs of those years are hard to predict: Tesla will keep spending heavily on software, compute and validation, and how much of that belongs to the robotaxi business is not disclosed. Second, the fleet should pay for itself as it grows: a Cybercab earns back its cost in about 11 months (Exhibit 3), so we assume the cash it earns early on goes into building more robotaxis rather than to shareholders. Third, the effect is small: profits before the fleet is complete come from a much smaller fleet, and they are discounted at about 19% a year, so they would add little to today's value compared with the value of the finished business. Leaving them out keeps our estimate on the cautious side.
Outside the US. Regulation is slower elsewhere, and in China local operators may dominate. We therefore value three regions separately, each following the US rollout some years later, with its own market share and profit per mile (Exhibit 12). We also size each region by how far people there travel by car today. Per person, cars cover about 40% of the US distance in other high-income countries (Germany 51%, France and Italy 47%, the UK 44%, Japan about 28%), about 20% for city dwellers in China and about 7% in the rest of the world, where India is at about 2% (national statistics such as Germany's KBA, Italy's ISTAT, the UK's DfT and China's NBS; US: FHWA). Together the regions add $0.23 trillion today, less than a fifth of the total. That is mainly a matter of timing: valued in the year each fleet is complete, the regions would be worth about $5.2 trillion, more than half the US business's $9.2 trillion in mid-2039. But they arrive 3 to 10 years later, and every extra year is discounted at about 19%, so the value of the rest of the world is divided by about 50 against about 9 for the US. They also earn less per mile and start from far fewer car miles.
Public transport. Sizing the regions by today's car travel means we assume robotaxis win trips from cars, not from buses and trains. We think that is prudent. Public transport carries far more trips outside the US: in Germany, buses, trams and trains carry most of the fifth of motorised passenger-km that does not go by car (Umweltbundesamt), while in the US public transport carries 1.5% of trips (National Household Travel Survey, 2022). It is often heavily subsidised and cheaper per trip than a robotaxi is likely to be, and in dense cities it is also fast. Some riders will still switch for comfort and privacy, a door-to-door ride and a seat of their own, especially on longer or late trips. That would be upside to our base case; in the cockpit, the car travel setting for each region shows its effect.
The multiple. We use 30 times profit for the US and every region, in the range investors pay for large technology companies that are still growing. It leaves room for adjacent services such as delivery, which we do not value separately.
Exhibit 12: Our base case by region
| Region | Full fleet | Car travel per person vs the US | Tesla's market share | Profit per mile vs the US | Robotaxis when complete | Value today |
|---|---|---|---|---|---|---|
| United States | mid-2039 | 100% | 30% | 100% | 12.4 million | $1.03 trillion |
| Other high-income countries | mid-2044 (5 years later) | 40% | 15% | 70% | 6.9 million | $0.19 trillion |
| China | mid-2042 (3 years later) | 20% | 5% | 40% | 1.4 million | $0.03 trillion |
| Rest of the world | mid-2049 (10 years later) | 7% | 10% | 30% | 2.9 million | $0.02 trillion |
| Total | 23.6 million | $1.27 trillion ($321 per Tesla share) |
Source: Laniakea Research robotaxi cockpit (base case as of 6 November 2026, market data of that day; 30x for all regions; 3.95 billion shares); region sizes from World Bank urban population (2024); car travel per person from national statistics (around 2023-24). Tesla's other businesses are not included.
Our base case is one set of assumptions. Rather than a few hand-picked scenarios, we show the full range of reasonable outcomes: the cockpit runs 10,000 futures, each drawing every input from a range around our base case: the US market share from 15% to 45%, the fare from $0.62 to $1.12 a mile, the year the US fleet is complete from 2038 to 2042, the multiple from 20x to 40x, the timing, share, car travel and profit per mile of each region outside the US, and the operating details (10th to 90th percentile in each case).
Exhibit 13: 10,000 simulated futures for Tesla's robotaxi business, per Tesla share (interactive)
Source: Laniakea Research robotaxi cockpit, Monte Carlo simulation around our base case (6 November 2026). Value per Tesla share at 3.95 billion shares.
The range is wide, as it should be for a business that is still being built: 8 in 10 futures lie between about $0.45 trillion and $2.32 trillion ($114 to $588 per share), with a middle value of $1.12 trillion ($283 per share) and an average of $1.29 trillion ($327 per share). The average lies above the middle because the best futures add far more value than the worst take away. In almost 4 in 10 futures, the robotaxi business alone is worth more than all of Tesla (at the closing share price of 5 November 2026). Four assumptions explain almost 90% of the range (Exhibit 14).
Exhibit 14: What drives the range of values
Source: Laniakea Research robotaxi cockpit, Monte Carlo simulation around our base case (6 November 2026).
How investors value the business, what riders pay, how fast the US fleet is built and Tesla's share of the US market matter most. The operating details we have discussed, from vehicle cost to remote supervision, matter far less, and so do the regions outside the US: they come late, so differences there weigh less in today's value. That is where the evidence of the next few years will count most.
Exhibit 15: Our base case in the cockpit
Source: Laniakea Research robotaxi cockpit.
The turning point does not change today's value; it changes the path. Before it, investors have good reason to doubt the thesis and apply our full discount rate. After it, we expect them to value the business like an established large company, at roughly the 10-year Treasury yield plus the market risk premium, or about 10% a year. The value therefore rises steeply in the years around the turning point and then more slowly. Across 10,000 simulated futures, the median value of the robotaxi business is about $283 per Tesla share today, $814 in 2030 and $2,886 in 2040 (8 in 10 futures between about $1,240 and $5,660 in 2040). These are values of the business under our assumptions, not forecasts of Tesla's share price. In Exhibit 16, and in the cockpit, readers can move the turning point themselves and see how the path changes.
Exhibit 16: How the value could develop to 2040, with the turning point (interactive)
Source: Laniakea Research robotaxi cockpit. Values of the robotaxi business under our assumptions, not forecasts of Tesla's share price.
Key risks to our view
- Regulation. Approvals are needed city by city and state by state, and the Cybercab's federal certification questions are open. A serious accident could delay the rollout by years. Outside the US, regulation could be slower still than our 3 to 10 years.
- Car ownership in cities proves sticky. We already assume that rural drivers and many suburban households keep their cars. The risk is that city dwellers keep theirs too, using robotaxis alongside their car rather than instead of it, so purchases fall later and less. This is the mainstream view (Exhibit 11).
- Remote supervision. If fleets need many more remote supervisors than we assume, costs rise; at Goldman Sachs Research's 2035 ratio our value is about 18% lower.
- Competition in self-driving cars. If self-driving becomes a standard feature that every carmaker offers, Tesla's share of privately owned cars, and its profit from them, could be smaller than we assume.
- Utilisation. Rush-hour and weekend peaks limit profitable hours per vehicle; we assume 14 a day across the fleet.
- Price competition. Aggressive competition could push fares below $0.82 and compress margins.
- Manufacturing scale. Our base case requires up to about 2.8 million new robotaxis a year in the US, including replacements, and, with the regions outside the US, about 4.5 million in 2040 and a peak of about 5.3 million a year in the early 2040s; Tesla delivered about 1.6 million vehicles in 2025.
- Legacy carmakers adapt. Early partnerships with autonomy providers, or efficient fleet-supply roles, could preserve more of the incumbents' position than we expect.
- Timing. A later turning point would shift the steep part of the value path by the same amount.
What we are watching over the next 12 months
- The Cybercab ramp. How many robotaxis drive with nobody on board, about 600 Tesla vehicles today, and how fast that number grows against our curve. In the cockpit: the year the fleet is in place.
- Regulation. NHTSA's view on vehicles without a steering wheel or pedals, and new state and city permits. In the cockpit: the year the fleet is in place.
- Fares. Tesla's riders pay about $2.45 a mile today on trips over four miles; our base case assumes $0.82 at scale. In the cockpit: the fare.
- Remote supervision. How many vehicles one person can oversee; we assume 256 at maturity. In the cockpit: robotaxis per remote operator.
- Car ownership. Whether car registrations start to fall in the cities where robotaxis reach scale first, beginning with Austin. In the cockpit: the market share.
Methodology
We value Tesla's robotaxi business in the US and, some years later, in three regions outside the US. The model builds a year of revenue and costs for one vehicle, scales it to a US fleet set by market share, applies a terminal P/E multiple of 30 to the after-tax profit in the year the fleet is complete, and discounts that value to today at a CAPM-based rate plus a 5% business-specific risk premium. Each region outside the US is the US business scaled by its urban population, how far people there travel by car compared with Americans, Tesla's share there and its profit per mile, reached some years later and discounted at the same rate. Rides in privately owned self-driving Teslas count towards the market share, at similar profit per car. Corporate overhead and software development are not deducted; we treat them as part of Tesla's wider business. All inputs, the 10,000-scenario Monte Carlo simulation, the turning point and the regions outside the US can be changed in our free Tesla robotaxi cockpit: try the market share, the fare or the year the fleet is complete. Model figures are our base case as of 6 November 2026, with that day's market data (10-year Treasury yield 4.84%, Tesla beta 1.81) and Tesla's closing share price of 5 November ($343.69). We test the assumptions every week and adjust them when new evidence requires it; the cockpit shows how our base case has changed and why.
Our current model for this topic is live in the Tesla Robotaxi cockpit. The research page has our base case today, videos and all our reports on it.
Laniakea Research holds positions in Tesla and SpaceX and may benefit if their share prices move. Not investment advice.
More from Laniakea Research
Laniakea Research launches its new website: value the moonshot yourself
Laniakea Research has launched its new website, bringing its free valuation cockpits, research reports and news together in one place, built around one idea: don't just read our view, test it.
Our valuation models are now free, interactive and in your browser
Laniakea Research has turned the models behind its investment decisions into free web tools: one for Tesla's robotaxi business and one for SpaceX's orbital data centers.
Orbital Data Center Economics: Why AI Compute Is Migrating to Orbit
Our full report on SpaceX's orbital data centers: the physical, operational and financial case for AI compute in orbit, from launch costs to the total cost of ownership.