Tesla's $1T Robotaxi Opportunity: What a Professional Bottom-Up Valuation Reveals
- Apr 2
- 23 min read
Updated: Apr 9
Tesla’s current market capitalization remains a puzzle for traditional automotive analysts. While core vehicle delivery growth has recently flatlined, the company continues to trade at a valuation that dwarfs the rest of the industry combined.
Is this a "meme stock" fueled by retail sentiment, or is the market pricing in a fundamental business shift that has yet to be fully quantified?
In our latest research deep-dive, we apply private equity rigor to perform a detailed, bottom-up valuation of the Robotaxi opportunity. Here is the summary of our findings.
The Thesis: From Hardware to Mobility-as-a-Service
Tesla is signaling a pivot from selling hardware to drivers to selling miles to passengers. By focusing on Mobility-as-a-Service (MaaS), Tesla moves from the single-digit margins of legacy auto to the high-margin territory of software platforms.
The Unit Economics: The 33-Cent Mile
To find a high-conviction valuation, we modeled the unit economics of a single Cybercab with granular detail. Based on a $25,000 production cost and a 550,000-mile lifespan, we project a cost-to-serve of approximately 32.7 cents per paid mile at scale.
When priced at $0.82 per mile (parity with the "all-in" cost of private car ownership) Tesla captures a margin of roughly 60%. This represents an astronomical leap over traditional automotive profitability.
Scale: Disruption of a $1.7 Trillion Market
The real prize isn't just the taxi market; it's the systematic cannibalization of the $1.7 trillion Americans currently spend on private vehicle ownership.
Our "Base Case" scenario assumes:
Market Share: 30% of the U.S. addressable market by 2040.
Fleet Size: Approximately 12.4 million operational units.
Utilization: 590 billion paid miles per year.
The Verdict: Is $1 Trillion Justified?
Bringing these future cash flows back to the present requires a significant discount rate to account for the "venture-scale" risk of autonomy. Applying an 18.45% discount rate, our model arrives at a Present Fair Value of $1.1 trillion for the U.S. Robotaxi business alone.
While a valuation exceeding $1 trillion can be justified, the "bar" for execution has never been higher. Success hinges on four critical variables:
Technical Reliability: Achieving "superhuman" safety levels in all weather.
Operational Velocity: The speed of national/ global fleet expansion.
Regulatory Clearance: Navigating a fragmented legal landscape.
Consumer Adoption: The psychological shift away from car ownership.
Watch the Full Deep-Dive
We have designed this valuation to be highly visual and intuitive, translating complex PE-level modeling into a clear narrative.
For the full data set and the expanded sensitivity tables, you can read the complete Robotaxi Economics Report here.
Click on arrows to see key slides


Click to expand full video script
Intro [00:00]
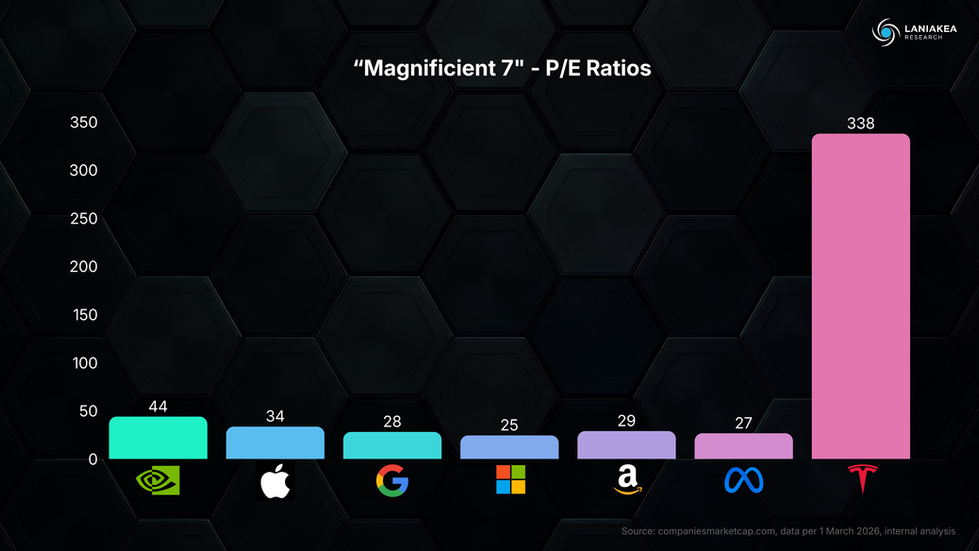
Tesla’s valuation trajectory is nothing short of remarkable, defying traditional automotive logic by surpassing every other manufacturer by a significant margin. Tesla is valued more than the next ten largest automakers combined, a statistic that highlights just how differently the market perceives this company compared to a Ford or a Toyota.
This disconnect is most visible in its price-to-earnings (P/E) ratio, which consistently trades at levels more typical of a high-growth software firm than a capital-intensive hardware manufacturer.
To be fair, Tesla earned this premium by fundamentally disrupting the industry. By achieving mass-market EV adoption when many deemed it impossible, they single-handedly forced the global automotive industry to pivot toward electrification.
However, the narrative is shifting. While Tesla once enjoyed uncontested sales growth, those numbers have recently flatlined, and now even declined. Meanwhile, the competition is closing the gap in both EV efficiency and manufacturing profitability.
This raises the central question for any investor: Why does the market cap still dwarf the rest of the industry if the core "auto" growth has stalled? Is Tesla just an overvalued "meme stock" fueled by retail sentiment?
To find out, we’re conducting a full bottom-up valuation of the Robotaxi opportunity, applying the same private equity rigor I used as a transaction manager. And by the end, you may just be a valuation expert, too.
Disclaimer & Scope [01:42]
Before we dive into the numbers, a quick but necessary heads-up: I personally spent over a decade working as a transaction manager in M&A, where I specialized in dissecting complex business models and determining their fair value. While I’m bringing that professional lens to this study, I want to be clear: I am not a financial advisor.
The following analysis is for educational purposes only. It is not a recommendation to buy or sell any security, and I do not provide public investment advice. Any financial decisions you make are at your own risk.
Now, a word on our scope. Tesla is a complex conglomerate with major bets in energy storage and humanoid robotics, among others, but to keep the signal-to-noise ratio high, we’re focusing exclusively on the Robotaxi opportunity.
The rationale is the following: Tesla is now "all-in" on autonomy. With the discontinuation of the legacy Model S and X and the Cybercab officially entering mass production, the company has signalled that its future is no longer about selling hardware to drivers but about selling miles to passengers. While the other business lines are fascinating, we believe the autonomous robotaxi network is the primary near-term value driver for the current market capitalization. To analyze everything else would break the scope of this video, so today, we are valuing the Robotaxi opportunity.
Valuation Basics [03:08]
To understand if Tesla is overvalued, we first need to discuss how we value any asset. In the simplest terms, the value of a stock is the sum of all its future free cash flows, discounted back to today to account for the time value of money and risk.
Essentially, a dollar tomorrow is worth less than a dollar today. The riskier the assumptions, the higher the discount rate, and the lower the "present value" of those future billions.
Now, determining those future cash flows is the real challenge. While we typically use complex Discounted Cash Flow (DCF) models, those often get bogged down in microscopic details that can obscure the big picture.
An alternative is to project the Terminal Value of the business at a future point and discount it back to its Present Value. For this model, we assume a zero-dividend policy, meaning all free cash flows generated in the interim are fully reinvested into the business.
To keep it simple and digestible in this video format, we’re going to estimate the Terminal Value using a simplified multiples approach. Because there are so many "known unknowns" with autonomous driving, we focus on a few key value drivers. It’s a cleaner way to see what the market is actually pricing in without getting lost in a spreadsheet.
Applicable Business Model [04:34]
Before we can start projecting cash flows, we have to determine how the Robotaxi business model will actually function. The economics of autonomy offer a few distinct paths:
Option A: The Direct Sale. Tesla sells the car to a consumer for an upfront margin, then collects ongoing revenue through a self-driving subscription. This is essentially the current model, but as we move toward the "Cybercab", a vehicle without a steering wheel, this becomes a temporary bridge.
Option B: Mobility as a Service (MaaS). Tesla operates its own fleet and provides rides for a fare, much like a driverless Uber.
Option C: The Licensing Model. Tesla sells autonomous hardware to third-party fleet operators. This is the "capital-light" route, offering Software-as-a-Service-like (SaaS) margins without the headache of managing thousands of physical vehicles. Or,
Option D: The Hybrid. A combination of all the above.
In the long term, we will likely see the hybrid option. However, for our valuation, we are focusing primarily on Option B: Robotaxi mobility-as-a-service.
Here’s why: Option C is difficult in the near term because no one currently has the network or infrastructure to scale a nationwide or global fleet. Option A, selling a steering-wheel-less car to an individual, only works if the software is 100% reliable, everywhere, which isn't the reality today.
By focusing on Option B, we capture the highest potential margins, even if it is more capital-intensive. While some people will likely always want to own a private car for the status, convenience or as a hobby, we can assume for this simplified valuation that Tesla will price those private sales to be as profitable as the taxi service. Therefore, we’ll treat the Robotaxi fleet as our primary valuation driver.
Key Valuation Drivers [06:43]
To determine a valuation for Tesla’s robotaxi business, we need a model that simplifies the complexity into something digestible. Valuation is ultimately determined by future free cash flows, so we need to project the profitability and scale of the business at a future point in time.
Essentially, if we know how many rides are being provided, at what price, and at what cost, the valuation becomes a simple math problem. In our view, the most effective way to track this is on a per-mile basis. The Key Valuation Drivers are then just the number of Paid Miles times the Margin per Mile.
First, let’s look at Profitability or The Margin per Mile. This is a critical valuation driver, so we need to conduct a thorough bottom-up calculation where we factor in all the relevant cost components. Then we have to determine an appropriate market price to derive a reasonable Profit Margin.
Second, we have Scale or The Total Paid Miles, which is dependent on the Total Addressable Market and the captured market share. Which in turn is limited by production capacity and competition, but also technical hurdles of the self-driving technology itself. This is the most complex variable because it also depends on Price, the cheaper Robotaxi services can be offered, the more widespread they become and the higher the Total Addressable Market gets.
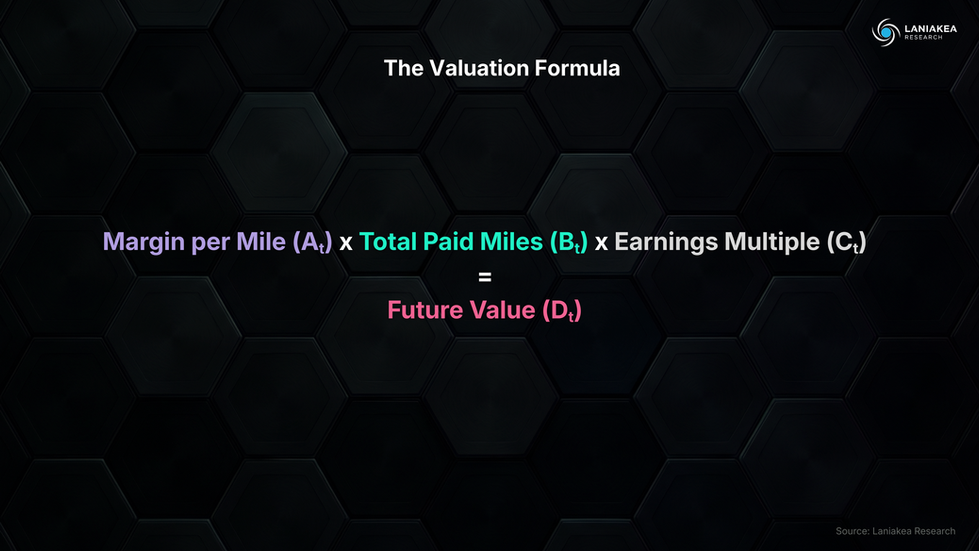
Once we have these key valuation drivers, the valuation formula is straightforward:
[Margin per Mile (At) x Total Paid Miles (Bt) × Earnings Multiple (Ct) = Future Value (Dt)]
We just multiply the Margin per Mile with the Total Paid Miles and attach an Earnings Multiple. This gives us the Future Value. We can then Discount that value back to today to account for risk and the time value of money and we have an estimate on how much the Robotaxi Opportunity could be worth today (D0). So, let’s determine these variables.
Profitability – The Margin per Mile (unit economics) [08:48]
To get to a high-conviction valuation for Tesla’s Robotaxi business, we have to solve for the unit economics of a single Cybercab with high granularity. In this video we will give a summary of the key assumptions to keep the video at a reasonable length. The full details can be found in our Robotaxi Economics report at laniakearesearch.com.
For our model we assume a $25,000 dollar production cost for the Cybercab once it reaches full volume production. This is grounded in Elon Musk’s Q3 2024 guidance and supported by the new "unboxed" manufacturing process, which removes the steering wheel, pedals, and traditional driver-assist hardware.
A critical factor here is the battery. Engineering lead Lars Moravy indicated in early 2025 that the Cybercab would use a "quite small" battery pack, under 50 kWh but would still achieve a real-world range of close to 300 miles. We assume an efficiency of 5.5 miles per KWh – a bit more conservative than implied by Tesla’s Lars Moravy.
We anticipate the use of LFP or Lithium Iron Phosphate chemistry; while LFP is heavier, it supports up to 5,000 charging cycles and can be charged to 100% daily without significant degradation. We conservatively assume only 2,000 full charging equivalents, resulting in a 550,000-mile lifespan. Because a Robotaxi achieves 12x higher utilization than a personal car, the capital depreciation per mile amounts to just 4.5 cents, or roughly 11% of the depreciation cost of a traditional vehicle.
We base our energy costs on the 2025 average electricity costs of around ~13.6¢/kWh and account for a 10% loss from inductive wireless charging. The fuel cost is approximately 80% lower than a gasoline equivalent driven by the highly efficient design of the Cybercab.
EVs already benefit from fewer moving parts, but the Cybercab is "hardened" for fleet use. Applying a 40% reduction to current EV maintenance baselines due to the smaller, simplified design, we arrive at a figure that is roughly 35% of a traditional gas car’s upkeep.
Since AI doesn’t suffer from fatigue or distraction, accident rates should plummet. We’ve modeled this at 22% of a personal car's premium, with the expectation that this trends toward zero as the technology matures and reaches "superhuman" safety levels. Already today, Lemonade is offering an up to 50% discount on premiums if the current Full-Self-Driving system is engaged.
A driverless fleet still requires a physical and regulatory footprint. As gas tax revenue disappears, cities will likely shift to other road usage charges. We’ve factored in roughly $2,000 per vehicle per year to cover these commercial fees and tolls.
Beyond the car itself, a scalable Robotaxi network requires a dedicated infrastructure of automated hubs for charging, cleaning, and maintenance. We’ve modeled these "fleet operation" costs at 3.2 cents per mile, split between charging infrastructure and sanitation.
To maintain maximum uptime without human intervention, we anticipate the use of wireless charging pads, allowing the fleet to self-charge autonomously between trips. This 1.9-cent-per-mile estimate accounts for the CapEx of the chargers, installation, and the necessary grid upgrades.
The remaining 1.3 cents per mile covers automated cleaning and safety inspections. Following the concepts Tesla has showcased on YouTube, these facilities would handle internal and external cleaning with minimal labor overhead. At an estimated $20 per cleaning once a week, we’re looking at roughly $1,000 per vehicle annually to keep the fleet in "rideshare-ready" condition.
For the foreseeable future, remote operators will still be necessary to handle "edge cases", situations where the AI is physically stuck or socially confused. However, as Mean Miles Between Intervention (MMBI) improves, the Robotaxi-to-Support ratio scales rapidly.
We estimate that industry leaders like Waymo already operate at a ratio of greater than 50:1, meaning a single support agent can manage over 50 vehicles simultaneously. Our modeling shows that as this ratio hits 1:256, the cost of human oversight falls below one penny per paid mile. A detailed model with calculations can be found at laniakearesearch.com.
We model an average of 14 operating hours per day, accounting for peaks and a 40% "deadhead" rate, meaning the miles driven empty between passengers. With these constraints, a single Cybercab covers around 220 miles a day, or around 80,000 miles per year, completing roughly 29 paid rides per day and effectively replacing four to five personal vehicles. With these metrics, the Cybercab should be able to operate a full day on a single charge.
Adding it all up, we project that a Tesla Cybercab fleet could achieve a cost-to-serve of approximately 32.7 cents per paid mile at scale by the mid-2030s.
To tie this all together, we need to determine the price of the service. The fundamental question is: at what price point would most people trade their car keys for an app?
We believe that for Mobility-as-a-Service (MaaS) to become the new normal, the cost needs to reach parity with the "all-in" expense of owning a personal vehicle, while essentially offering the “driver” and the autonomy for “free”. Based on private ownership data from the American Automobile Association (AAA), that target is approximately 82 cents per mile, excluding any parking costs.
When you compare that to three dollars per mile average for traditional ride-hailing today, we’re looking at a compelling ~70% cost decline.
At this 82-cent price point, and with our calculated cost basis of 32.7 cents, Tesla would capture a margin per mile of 49 cents or roughly 60%. [At = 49ct] To put that in perspective, while it doesn't quite reach the 70% to 90% margins typical of pure software-as-a-service, it is an astronomical leap over the single-digit margins of the traditional automotive industry.
Scale – The Total Paid Miles [15:47]
To understand the scale of the Robotaxi opportunity, we have to look at the "wallet share" of the average consumer. According to 2025 Bureau-of-Economic-Analysis data, U.S. consumers spend about $37 billion annually on taxis and ride-sharing. While that sounds significant, it represents a mere 0.18% of total personal consumption.
But the real prize isn't just the ride-hailing market; it's the $1.7 trillion currently spent on private vehicle ownership, covering everything from new and used car purchases to fuel, maintenance, insurance, and parts. That is over 8% of the entire U.S. economy ripe for disruption.
Typically, spending across categories remains relatively constant as a percentage of a household budget. Therefore, we can assume that as Robotaxis mature, they won't just compete with Uber; they will systematically cannibalize the $1.7 trillion spent on owning and operating personal cars, aligned with the service price we set earlier.
We could also account for the imputed labor cost of driving. In 2023, Americans spent 88 billion hours behind the wheel. If we value that "lost" time at even 20% of an average salary, we're looking at an additional hidden $800 billion annual opportunity currently locked behind a steering wheel.
Theoretically, demand for transportation should increase as the service becomes more valuable. If your time in the car is no longer "lost," you may be tempted to be on the road more often. In consequence, Robotaxis likely won't solve congestion, they may actually amplify it as utilization rises. If we would add the value of time to the existing transport spend, the theoretically addressable U.S. market would climb to $2.5 trillion.
However, we have to be realistic about geography. Roughly two-thirds of the U.S. population lives in the 300 largest urban areas, roughly 80,000 square miles, where population density is generally above 1,000 people per square mile. In rural areas, the "deadheading" costs of a fleet service might be too high to be economical. If we exclude the rural population, we arrive back at a $1.7 trillion addressable market. Even if those rural users eventually buy their own private autonomous Robotaxis, we believe the $1.7 trillion remains a solid estimate for the U.S. Total Addressable Market (TAM).
Next, we have to account for the Adoption Curve, as this transition won’t happen overnight. There are three primary anchors slowing the shift from personal ownership to a fully autonomous fleet.
First, there is the Technical Bar. For Robotaxis to become a true "utility," they must achieve "all-weather" capability, handling heavy snow, rain, and dense fog with the same level of reliability as a seasoned human driver. Until the system is geographically and environmentally unrestricted, it cannot fully replace the family car.
Second, we anticipate a "Second Car" Phase. Most households won’t liquidate their entire garage immediately. Instead, they will likely replace a second or third vehicle with a Robotaxi subscription first, while retaining one "legacy" vehicle for specialized use cases, like camping trips, long-distance vacations, or hauling heavy equipment, where autonomy may not yet be the optimal solution.
Finally, we must consider the Psychological Barriers. For a large segment of the population, a car is more than just transportation; it is a mobile storage unit or a status symbol. While we already see younger generations increasingly willing to forgo the burdens of ownership, older generations will likely take much longer to adapt.
Of course, we also have to take into account competition. The market will likely be dominated by two or three large players, similar to the Uber and Lyft duopoly, due to massive network effects. Currently, Waymo is the clear leader in autonomous ride-hailing, but their strategy is different. They use an expensive sensor suite to target the high-priced taxi market first, intending to optimize costs later.
Tesla on the other hand is taking the "Maximum Risk" approach: optimizing everything from the hardware to the manufacturing in parallel, to go for the "endgame" immediately, aligned with its CEO’s risk appetite. Tesla is currently the only player with the manufacturing scale, service network, cost-optimized vehicle, and a scalable vision-based Full-Self-Driving system that doesn't heavily rely on HD maps. While Waymo may dominate the premium taxi niche today, we believe Tesla’s vertical integration and cost advantages will eventually allow them to overtake Waymo and capture a broader share of the personal transportation market.
With the limited scaling data available today and the long list of hurdles yet to overcome, it is essentially impossible to predict the scale of operations at a future point in time with high certainty. Rather than pretending to have a crystal ball, the more intellectually honest approach is to admit the limitations of any single-point forecast. To account for this uncertainty, it is sensible to calculate a sensitivity table rather than focusing on a point estimate. This allows us to see the "valuation envelope", ranging from a conservative disruption of the current taxi market to the full-scale replacement of the personal car.
That said, if we had to “guess”, we believe that by 2040, Tesla Robotaxis could cover ~30% of the TAM, which would require a fleet of approximately 12.4 million vehicles. To put that into perspective, that is around 50% more vehicles than Tesla has produced in total since its inception and 7.5 times its current (2025) production level.
For the purpose of this valuation exercise, this scale would result in roughly 590bn paid miles per year. [Bt = 590bn]. For comparison, Waymo is currently averaging 450,000 paid rides per week, translating to around 23 million rides per year, and equating to roughly 100 million paid miles annually. So, in our “guess”, Tesla would need to reach 5 to 6 thousand times the scale of Waymo’s current operations within a 15-year timeframe, which is admittedly quite ambitious, but achievable with good execution.
The Earnings Multiple [22:36]
Now that we have an estimate of scale and profitability, and therefore Robotaxis's future earnings potential, we need to evaluate how much those earnings are worth to an investor in the future.
The most straightforward way to do this is by applying an earnings multiple, specifically the Price-to-Earnings (P/E) ratio. This ratio is simply the company’s market value divided by its annual earnings; it represents how many years of profit investors are willing to pay upfront for a stock. To find a "fair" number, we look at how the market has historically valued similar companies and apply that logic to the Robotaxi opportunity.
Generally, the market follows two core principles when assigning a multiple:
The Growth Premium: Multiples are higher for companies that are currently growing fast or are expected to enter an accelerated growth period. Because the market is forward-looking, it "prices in" this expected growth upfront. The multiple then naturally "normalizes" as earnings eventually catch up to the valuation.
The Risk Discount: On the other hand, the multiple is higher when future cash flows are certain and low-risk. This is why established companies with monopoly-like market positions often carry higher premiums; investors are comfortable with a lower risk premium for a "safe" bet in a stable sector.
The challenge is that these two principles are often in contradiction. High-growth companies are typically much riskier, operating in volatile markets with intense competition. Determining the "net effect" of these forces is difficult and usually requires more sophisticated, bottom-up techniques like Discounted Cash Flow (DCF) modelling, where the P/E ratio is an output rather than an input.
We often see extraordinarily high P/E multiples when a company deliberately chooses to forego current earnings to capture a massive future market share. This is the classic Software-as-a-Service (SaaS) strategy: maximize reach and network effects by offering a product at low margins today, then monetize once the platform is dominant.
As of early 2026, Tesla carries an extraordinarily high P/E multiple of over 300, compared to its "Magnificent 6" peers, which typically trade between 25- and 30-times earnings.
This tells us that investors are already pricing in massive future growth. In a sense, Tesla has already foregone current profits by not releasing a more affordable manual car and instead going "all-in" on Robotaxis. They are betting that they can make the traditional steering wheel obsolete, which suggests a high level of confidence, or perhaps overconfidence, that large-scale autonomy is close to being solved.
It is important to remember that a high P/E ratio doesn’t automatically mean a company is overvalued. If a company has near-zero profits because it's betting everything on a new market, its P/E ratio can look infinite. In this context, Tesla, despite its size, is essentially still a start-up in terms of its ultimate autonomous ambitions.
When we evaluate a reasonable multiple for the Robotaxi business 10 to 15 years from now, we should look for a number representative of a stable, established, but still growing business.
Even once the core personal transport market is captured, massive growth opportunities will remain in adjacent sectors like food delivery, industrial transport, and international expansion. A company that dominates this space will likely carry a "platform premium." To be conservative, we will apply a 35x multiple for our valuation exercise. This is aligned with high-growth SaaS valuations but remains a bit higher than the current “Magnificent 6” average, reflecting the unique growth runway of a global autonomous network.
In our valuation exercise, we arrive at a future value of roughly 10tn in today’s Dollars.
The Discount Rate [26:45]
Now that we have a projected valuation for Tesla’s Robotaxi business in the future, we have to solve the most critical problem in finance: the time value of money. A dollar earned in 2040 is worth significantly less than a dollar in your hand today, not just because of inflation, but because of opportunity cost and risk.
To bring that future value back to the present, we apply a Discount Rate. Think of this as the "hurdle rate", the minimum annual return an investor requires to justify the risk of holding the stock.
We calculate the discount rate by breaking it down into three specific layers:
First, the risk free rate, this is the baseline. It represents the return you could get by putting your money in the safest possible place, typically 10-year U.S. Treasury bonds. As of the date of this video, this rate sits at around 4.0%.
Then, the market risk premium and beta. No one invests in the stock market for the same return as a government bond. The Market Risk Premium is the extra return investors demand for the volatility of the equity market. Historically this has been around 5.0%.
However, Tesla is not the "average" stock. We multiply this premium by the Beta factor (beta), which measures Tesla's volatility relative to the overall market [in finance we use volatility as a proxy for risk due to the lack of a better alternative]. As of the date of this video, Tesla carries a 5y beta of 1.89, meaning its price swings are significantly more aggressive than the broader market.
By applying the Capital Asset Pricing Model formula... we can determine Tesla’s current cost of equity at 13.45%.
Finally, the specific risk premium. While the market has speculative expectations for the robotaxi business baked into the share price, this inherent volatility is only partially captured by the Beta factor in our discount rate.
Because we are isolating the Robotaxi opportunity from Tesla’s more established automotive and energy storage segments, our model must incorporate an additional risk premium. This accounts for the unique and significant uncertainties inherent in this specific business plan.
First, we must factor in Technological Risk. This is the distinct possibility that reaching Level 5 autonomy takes fifteen years instead of five, or, in a bear-case scenario, fails to reach full reliability entirely.
Second, we have Execution Risk. Even with the software solved, the sheer logistics of scaling a global fleet are immense. This includes everything from the speed of service area expansion to the complex daily management of millions of autonomous units across diverse urban environments.
Third, we face Regulatory Risk. A fragmented "patchwork" of conflicting laws across different states and countries could significantly throttle the speed of a global rollout, even if the technology itself is ready.
Fourth, there is the matter of Capital Intensity. Unlike a pure software-as-a-service model, Tesla’s path to Robotaxis requires massive physical infrastructure, from high-volume factories to dedicated charging and servicing depots. This business plan carries a much heavier capital burden than a traditional tech expansion.
Finally, we must consider Adoption Risk. This represents the shifting consumer behavior away from private car ownership. We cannot overlook the psychological resistance to a new lifestyle or the cultural opposition to such a fundamental change in how we move.
After all, establishing Robotaxis as the 'new normal' mode of transport represents a seismic shift in human mobility, one that is likely more complex than the transition from gas to electric.
To be conservative, we apply an additional 5% risk premium to Tesla’s cost of equity. This brings our total discount rate to 18.45%, a figure that, in our opinion reflects the venture-scale risk of the Robotaxi mission.
It is important to remember that the absolute percentage is less important than its relationship to our underlying assumptions. In financial modeling, a conservative business plan with a lower discount rate should theoretically yield the same valuation as an aggressive plan paired with a correspondingly higher discount rate.
However, our goal is to model Tesla’s actual strategic targets. Given their stated ambition to produce millions of Cybercabs annually, it is clear they aren't just targeting a niche taxi market; they are aiming for the entire global mobility market. So, we should reflect that in our assumptions.
The Valuation [31:40]
We have now synthesized all the variables into a single valuation framework. By discounting the future cash flows of varying market shares and fleet sizes across different time horizons back to the present, we can derive the Present Value or the "Fair Value" of Tesla’s Robotaxi opportunity today.
We have intentionally masked the top-left cells; these outcomes are likely unrealistic given the massive production ramp required to hit those milestones so early.
In our Base Case scenario, assuming a 30% captured market share and 12.4 million operational robotaxis by 2040, we arrive at a present fair value of 1.1 trillion dollars. This alone, would account for the vast majority of Tesla’s current enterprise value.
As the sensitivity table illustrates, the valuation scales exponentially with higher market share and earlier deployment. Interestingly, our model shows that capturing a 15% share by 2035 is roughly equivalent to a 30% share by 2040 from a Present Value perspective. However, if Tesla can accelerate that 30% share to 2035, the present value more than doubles.
This highlights that the velocity of the robotaxi ramp-up is a critical variable in this equation; present values decay rapidly in the event of major technological or regulatory delays. It is also important to note that these figures reflect the U.S. market only. Any shortfall in domestic market share could potentially be offset by international expansion, as the Total Addressable Market (TAM) more than doubles when the rest of the developed world is factored in.
Let’s enter our valuation dashboard. This is the most critical part of the modeling process because it allows us to stress-test our assumptions and isolate the most powerful value drivers. By "playing" with these inputs, we can see exactly how sensitive the valuation is to even slight changes in our baseline.
Let's look, for example, at the vehicle’s production cost. As we increase this value, we can see that the profit margin and valuation steadily decrease. An unoptimized vehicle with an expensive sensor suite could easily cost $100,000, which would almost half our profit margin and the resulting valuation. Once the market is eventually saturated and prices per mile come down, cost-efficiency will be the critical factor in staying competitive.
Looking at teleoperation costs, we only need approximately 220 Mean Miles Between Interventions (MMBI), or around one intervention per car per day, to achieve a robotaxi-to-support ratio of 50:1.
At this ratio, the business is already highly profitable, with margins steadily improving as this measure scales. This shouldn't be surprising when you consider the labor arbitrage involved: you are effectively replacing 50 traditional drivers with a single remote supervisor. Notably, this level of reliability is already being demonstrated by Waymo today, which explains their current push for aggressive fleet expansion.
The amount of Deadheading, the miles travelled empty to reach the next customer, is also a crucial variable. In our Base Case, we assumed a deadheading rate of 40% of total miles driven, which aligns with what Uber and Lyft achieve today in urban environments.
However, there is a clear path to improving this efficiency. Unlike Uber drivers, who operate on individual schedules and disparate incentives, a robotaxi fleet acts as a singular, centrally optimized organism. This allows for a much more sophisticated network orchestration to maximize proximity to the next passenger.
The more dominant your presence is in a specific region, the lower your deadheading will be and the shorter the wait times for your customers. These network effects create a "winner-takes-most" dynamic; you need significant density to realize true economies of scale, meaning only a few players will likely be profitable in any given market. As our model shows, margins improve significantly as we drive down the percentage of deadheading miles.
Clearly, the price per mile and the resulting profit margin are the major value drivers of this model. While we expect prices to steadily decline from current levels as the market matures and competition increases, we believe margins will remain highly attractive for the industry's most efficient and innovative players.
We can also adjust the Risk Premium to observe its impact on valuation. Given our long projection period, the model is highly sensitive to the discount rate; a shift of just one percentage point can swing the resulting valuation by over 10%.
However, it is important to remember that the Discount Rate also reflects the implied annual return an investor would generate if these scenarios were to materialize as modeled. To put this in perspective, we can calculate the level of scale required to achieve a 10% rate of return, matching the historical average of the S&P 500.
An investor could still achieve attractive, market-beating returns even in a much more conservative scenario. For instance, if Tesla only captured a 15% market share by 2045, which is half the share and five years later than our Base Case, the return profile remains compelling. This suggests there is significant room for delays or lower adoption while still outperforming the broader market.
Looking at the spread of these numbers, you can see why valuation is often described as more of an art than a science. The spectrum of possible outcomes is exceptionally wide, and determining the most likely one requires experience and qualitative judgement.
The Verdict [37:54]
So, is Tesla overvalued?
Based on our analysis, we can conclude that the business opportunity is so vast that a valuation exceeding $1 trillion can be justified, provided there is a credible basis to believe Tesla will be at least partially successful in its ambitions. As of today, we haven’t identified any definitive "hard roadblocks" that would fundamentally prevent that from being the case.
The market currently reflects high confidence in Tesla’s roadmap, with significantly more growth priced in today than what we saw ahead of the Model 3 and Y production ramps. While this premium makes sense given Tesla’s proven track record, it also means the 'bar' has been raised. With so much of the future already baked into the current valuation, execution will need to be top-tier.
As we look ahead, the valuation will hinge on a few critical variables that we plan to track in future videos, technological reliability (Miles Between Interventions), operational velocity (geographic and fleet expansion), regulatory clearance, and consumer adoption.
Essentially, Tesla must prove it can build a "driver" safer than a human, deploy it rapidly across global markets, navigate a complex legal landscape, and convince a generation of car owners to embrace a subscription-based mobility model.
Ultimately, this is where you, the retail investor, may be better positioned than the experts. Predicting how many robotaxis will roam the streets in 2040, or whether 82 cents per mile is cheap enough to change a generation’s lifestyle, is not an exact science.
A financial analyst at an investment bank doesn’t necessarily have a better crystal ball than you do. No one truly knows how this trajectory will unfold, and you should be very sceptical of anyone who claims they do. In the world of rapidly developing technology, nothing is guaranteed, but it will certainly be an incredible shift to experience.
Thank you for watching. If you found this analysis valuable, subscribe to join us, for more financial deep-dives into the technologies that change the world.
